
📈 Leveraged data-informed design to increase sales.
Combined user and trend research with data-informed insights, such as e-commerce heatmaps and A/B testing to drive an average 8% year-over-year sales growth in a competitive market. Focused on aligning each design solution with business goals while ensuring it resonated with the target audience.
🎯 Goals & Metrics
8% Year-over-Year Sales Growth: Achieved through user-informed design and trend forecasting.
20% Faster Go-to-Market Turnaround: Enabled by streamlined vendor communications and agile production strategies.
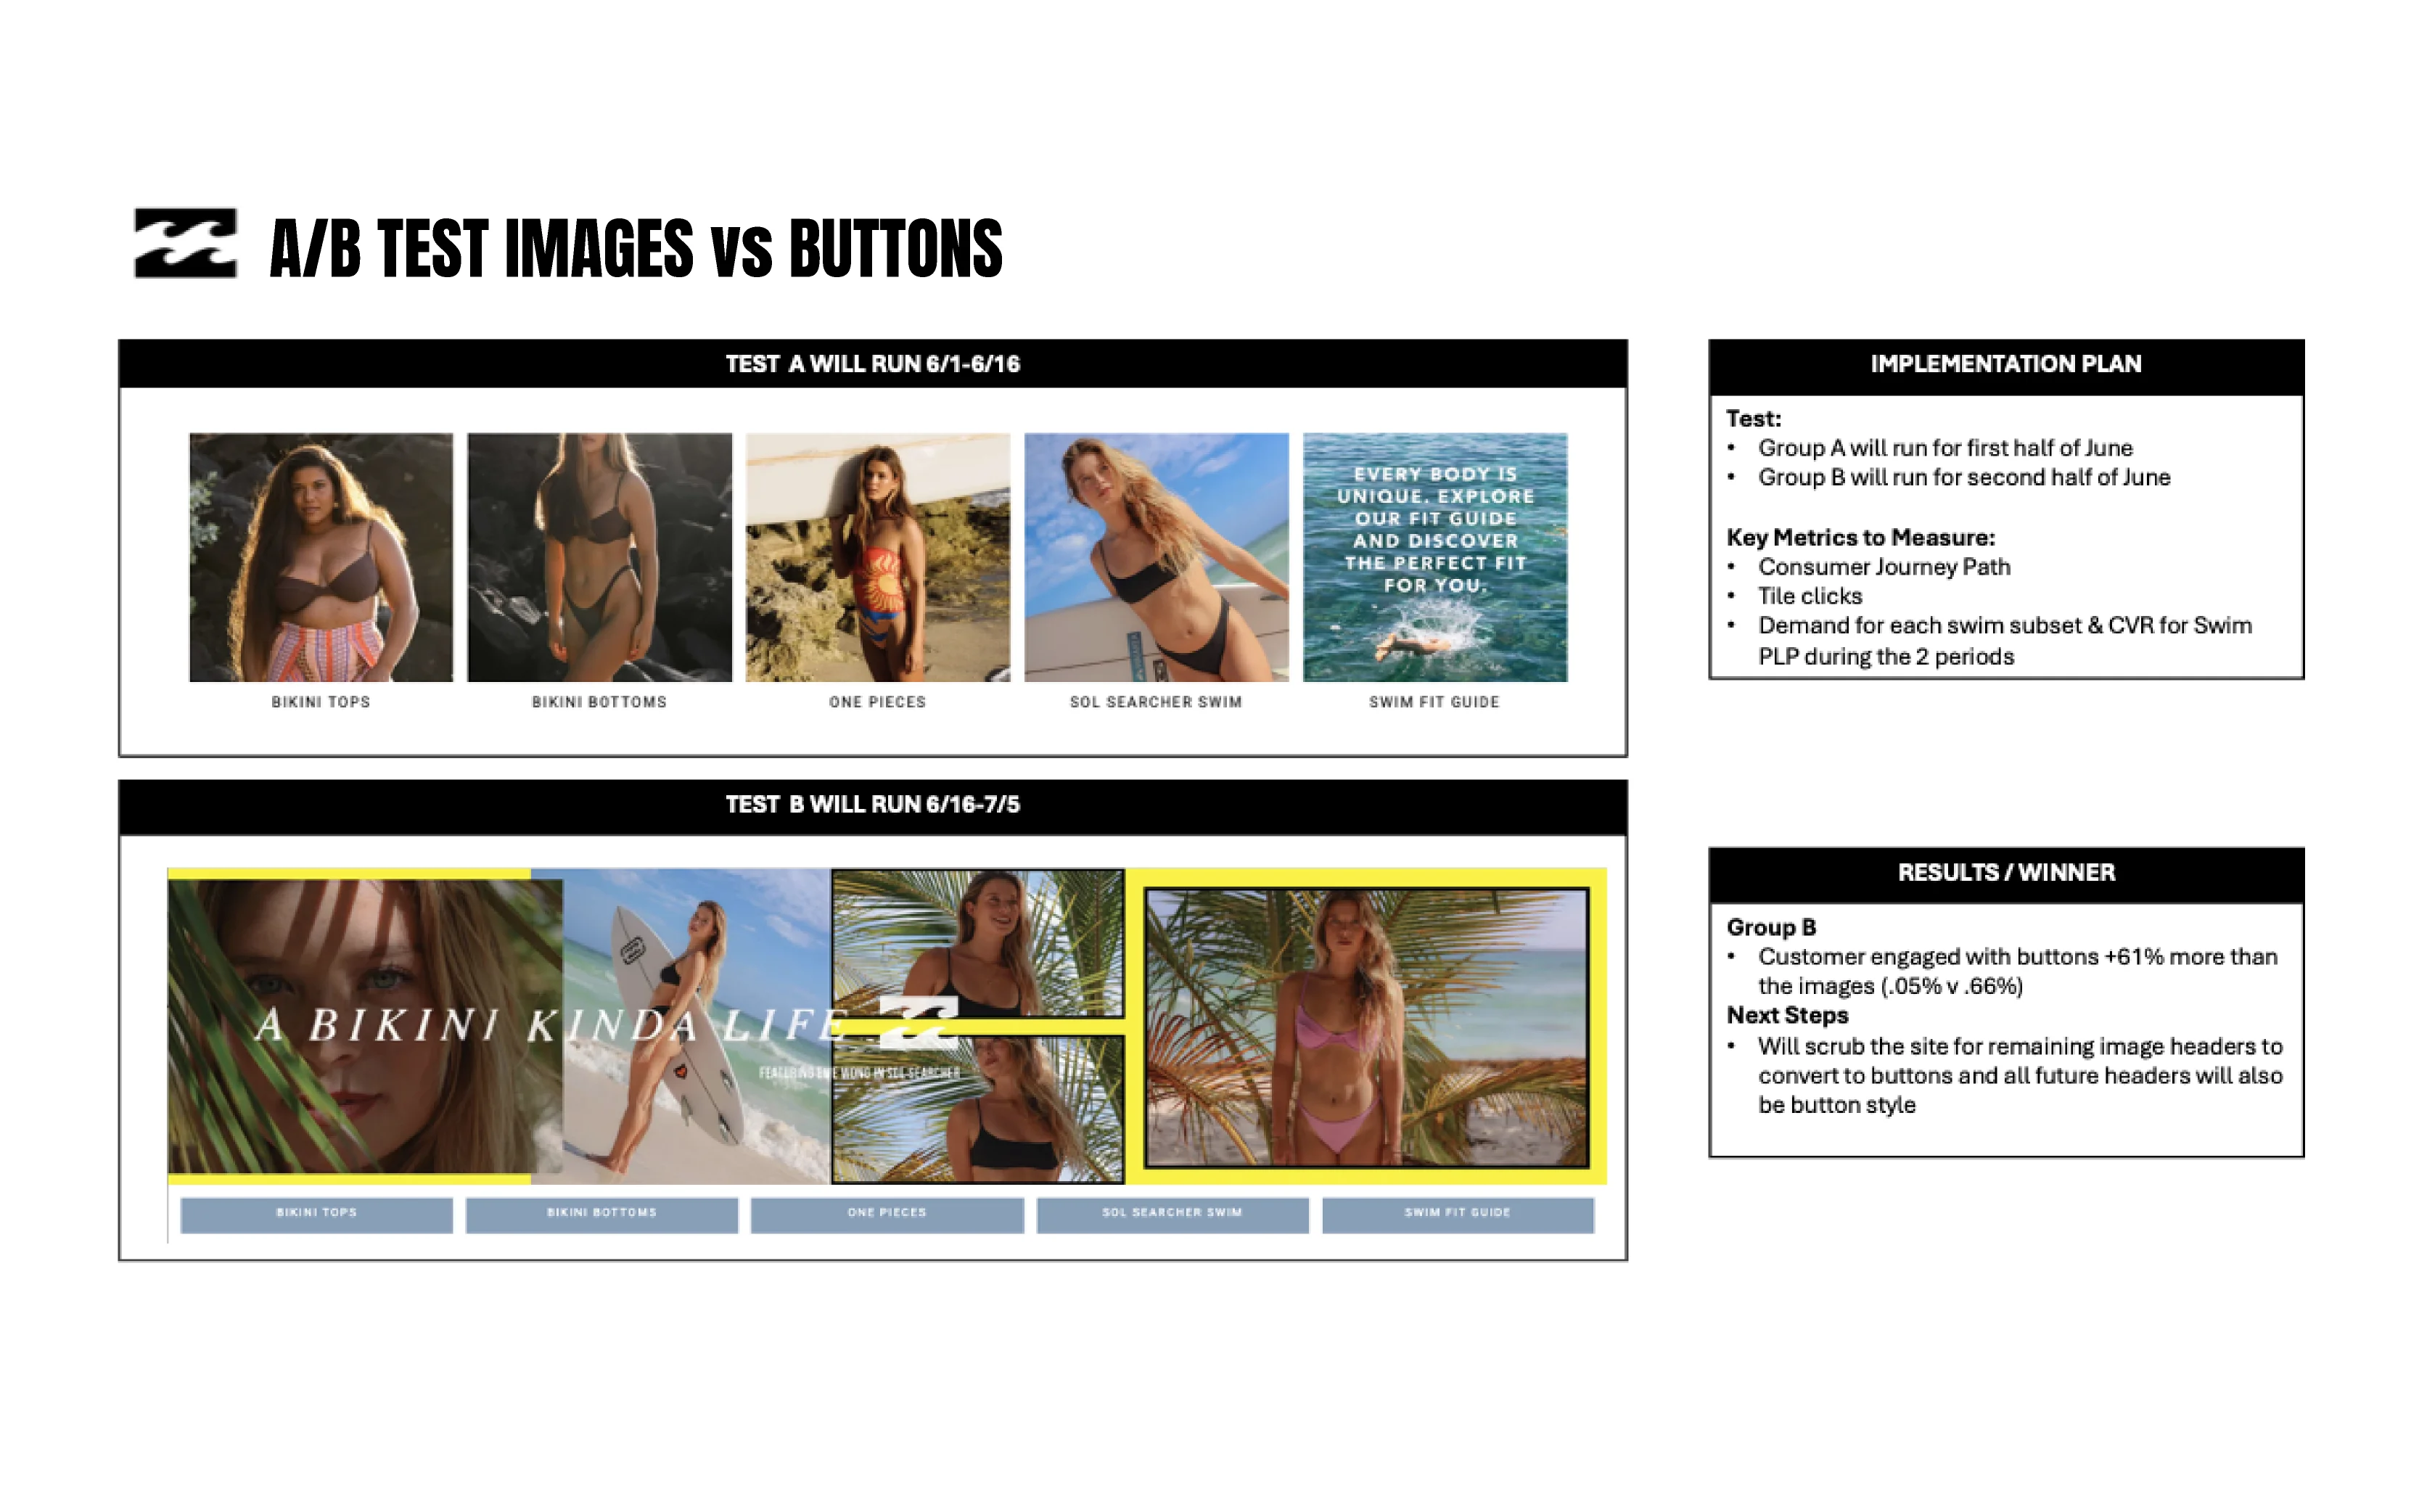
15% Higher E-Comm Engagement: Driven by A/B tested iterations, optimized visuals and product offering.
+8%
YoY $ Growth
+20%
Faster Turnaround
+15%
User Engagement

🧠 User Research
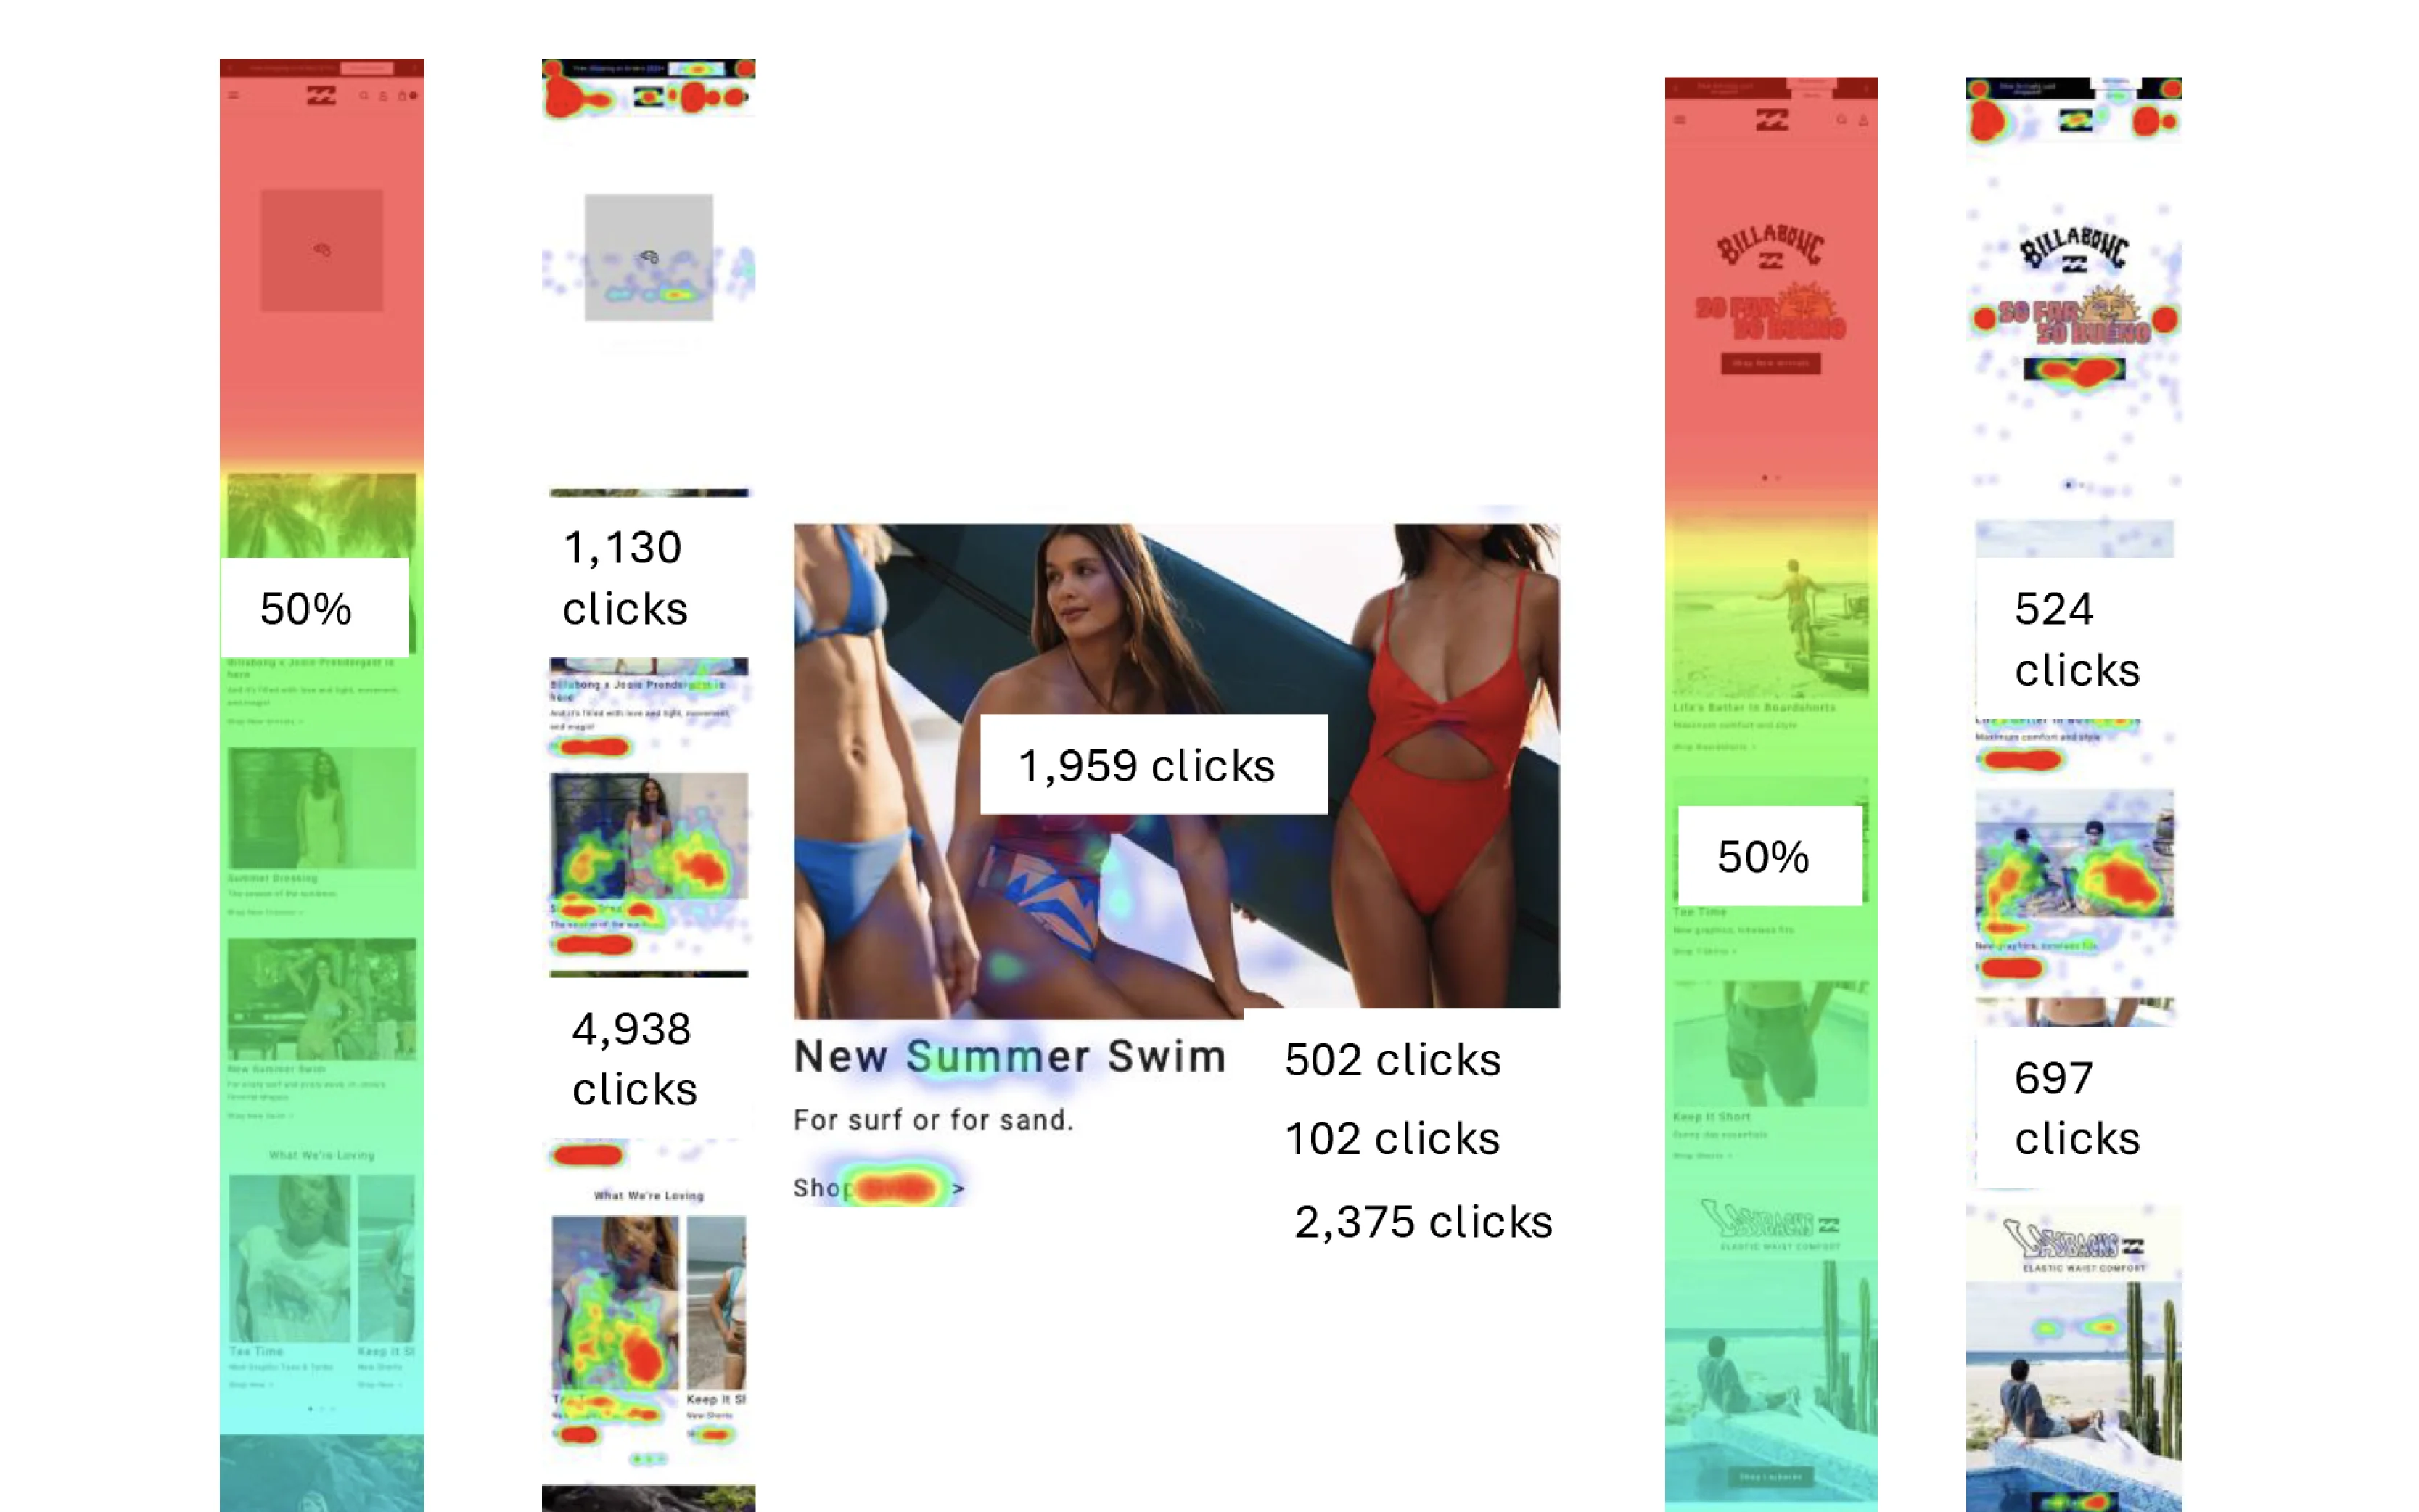
Heatmaps: provide critical insight into user behavior, enabling the team to better understand our e-commerce audience and optimize product offerings to drive sales.
Trend research: combined with real-time sales feedback from all channels also helps prioritize styles with high potential.
Direct feedback from retail partners and consumers: highlighted patterns in what styles resonated most.
By combining all of this data: we’re able to generate meaningful insights that inform smarter design and business decisions.

🚧 Challenges
Despite navigating high inventory carryover from the COVID era, economic uncertainty and ongoing importation delays, we’ve maintained a sharp focus on user needs and agile design strategies. By applying UX principles, like continuous user research, rapid iteration, and cross-channel data analysis we’ve stayed ahead of shifting demand. This allowed us not only to adapt quickly but to grow consistently, ensuring product-market fit and sales momentum even in a volatile landscape.


